Chapter 8 EGAT internal electricity use and pump and storage
EGAT internal electricity use is categorized into 5 groups as follows:
- EGAT head office and others
- EGAT substations and their offices
- EGAT station services (other processes in force outage power plants)
- Mae Moh mining
- EGAT pump and storage system
The EGAT electricity consumption data is obtained from Power System Control and Operation Division (ฝ่ายควบคุมระบบกำลังไฟฟ้า (อคฟ.)), Power Generation and Purchase Data Processing Department (กองประมวลผลข้อมูลการผลิตและซื้อขายไฟฟ้า (กผฟ-ส.)) website (EGAT intranet only).
8.1 Electricity consumption in EGAT head office and others
Electricity consumption is taken from Head of National Load forecast section. The file name is 01 EGAT_20Oct2022_งบ66 67_Final.xlsx. The R code chunk is given below.
use_office <-

  read_excel("raw_data/01 EGAT_20Oct2022_งบ66 67_Final.xlsx",
             sheet = "C_LossUse",
             range = "C18:D45",
             col_names = c("year_th", "ely_gwh")) %>%
  mutate(year = year_th - 543)
An electricity use in EGAT head office and others reached its peak 37 GWh in 2019. In 2023, it assumed that the electricity consumption will be similar to those in 2018 at 35 GWh due to EGAT staff returned to work onsite (see Figure 8.1).
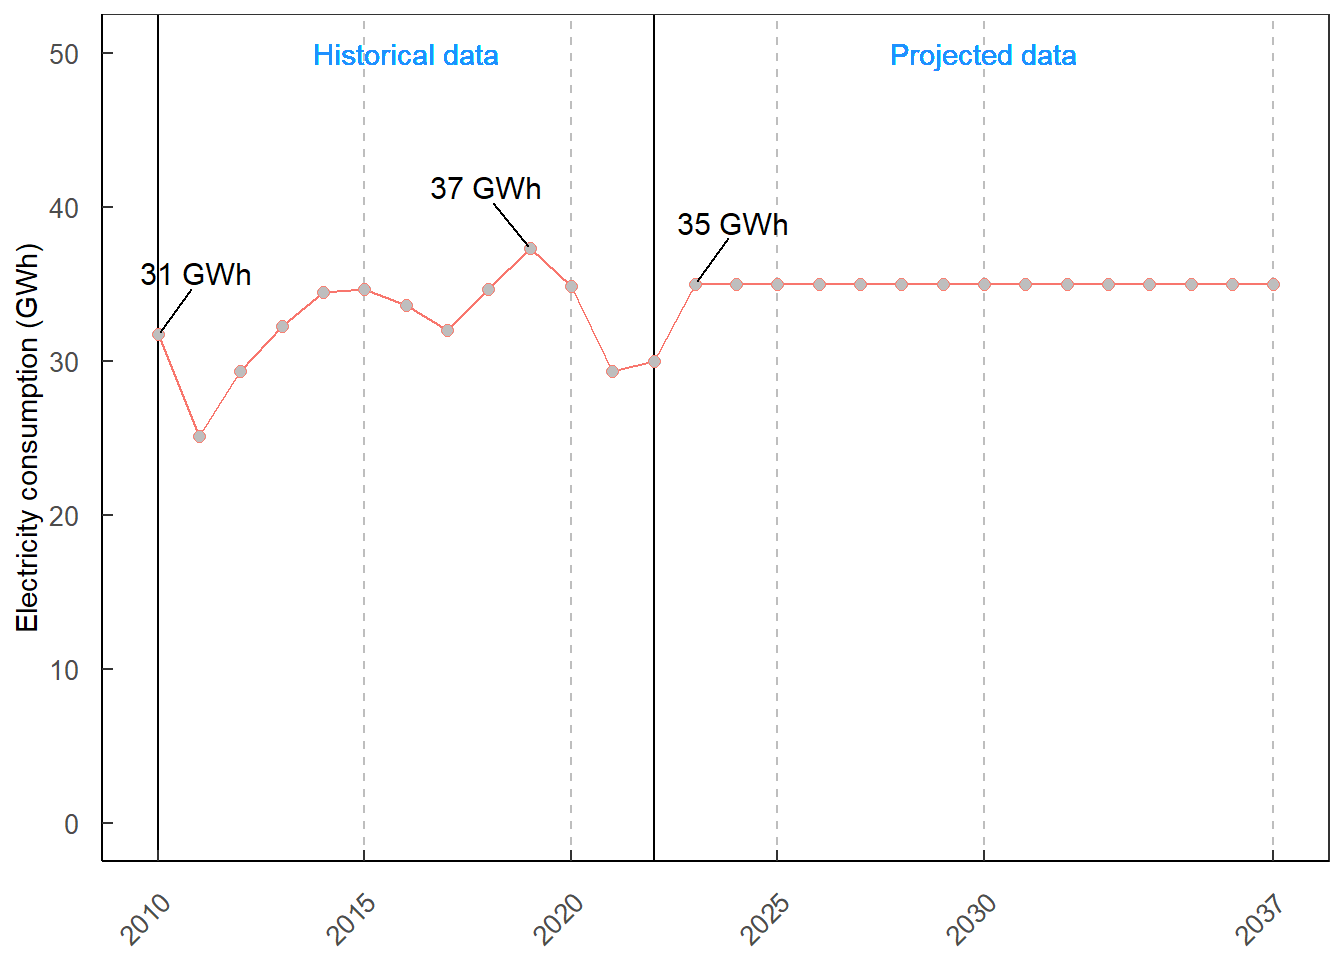
Figure 8.1: Electricity consumption in EGAT head office and others
8.2 Electricity consumption in EGAT substations and their offices
The data is extracted from 01 EGAT_20Oct2022_งบ66 67_Final.xlsx. The R code chuck is given below.
use_egatsub <-

  read_excel("raw_data/01 EGAT_20Oct2022_งบ66 67_Final.xlsx",
             sheet = "C_LossUse",
             range = "C59:D86",
             col_names = c("year_th", "ely_gwh")) %>%
  mutate(year = year_th - 543)
An electricity consumption in EGAT substations decreased from 84 GWh in 2010 to 64 GWh in 2015. It is assumed that the electricity consumption will be similar to those in 2019 (see Figure 8.2).
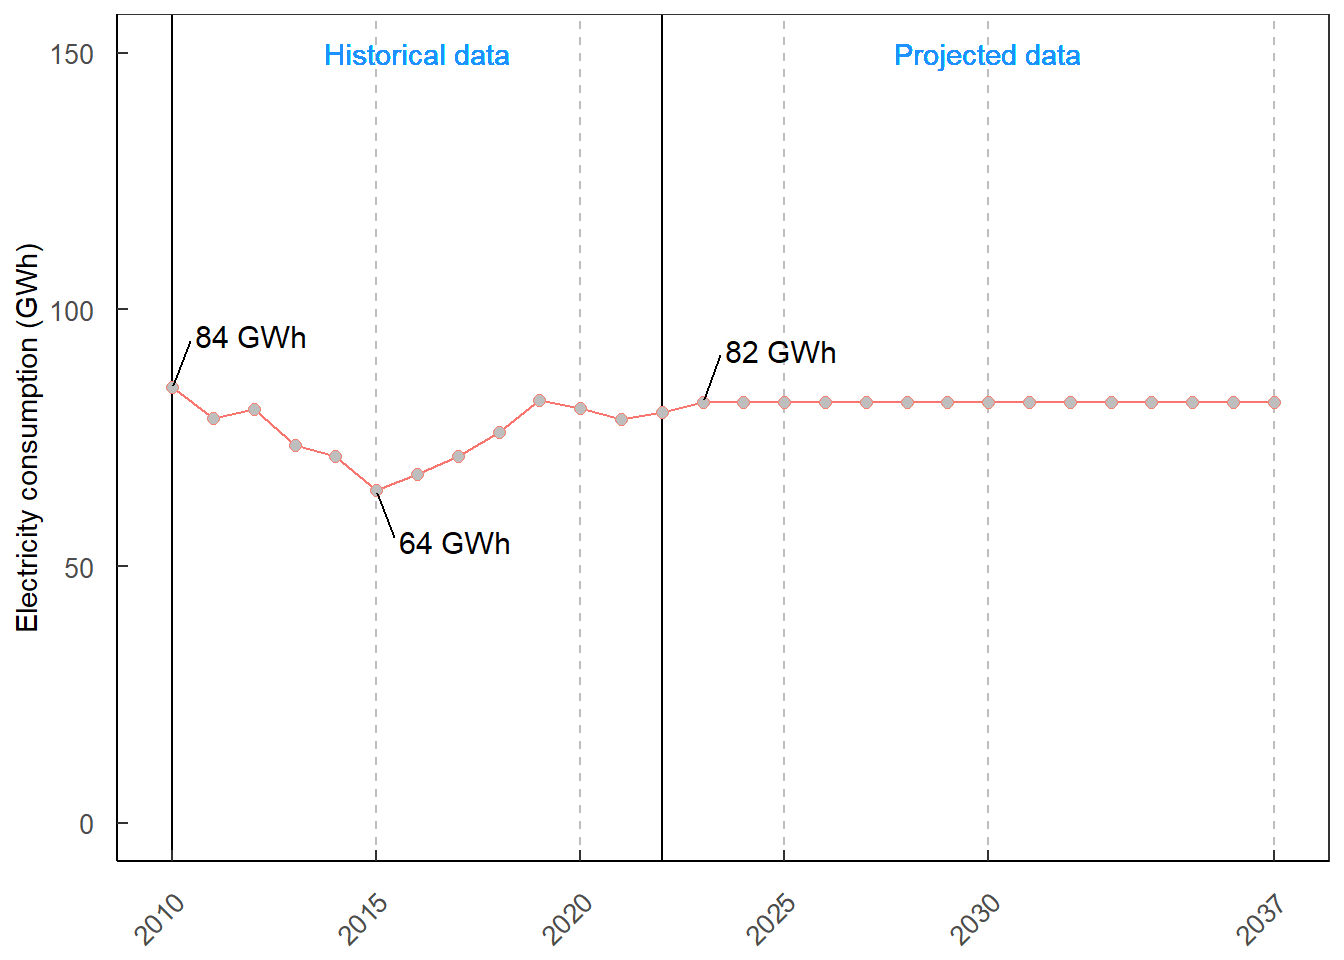
Figure 8.2: Electricity consumption in EGAT substations
8.3 Electricity consumption in station service (off-load)
The data is extracted from 01 EGAT_20Oct2022_งบ66 67_Final.xlsx. The R code chuck is given below.
use_statserv <-

  read_excel("raw_data/01 EGAT_20Oct2022_งบ66 67_Final.xlsx",
             sheet = "C_LossUse",
             range = "C100:D127",
             col_names = c("year_th", "ely_gwh")) %>%
  mutate(year = year_th - 543)
An electricity consumption in station services (off-load) reached its peak 103 GWh in 2022. It is assumed that the consumption in 2023 would be similar to those in 2019 (see Figure 8.3).
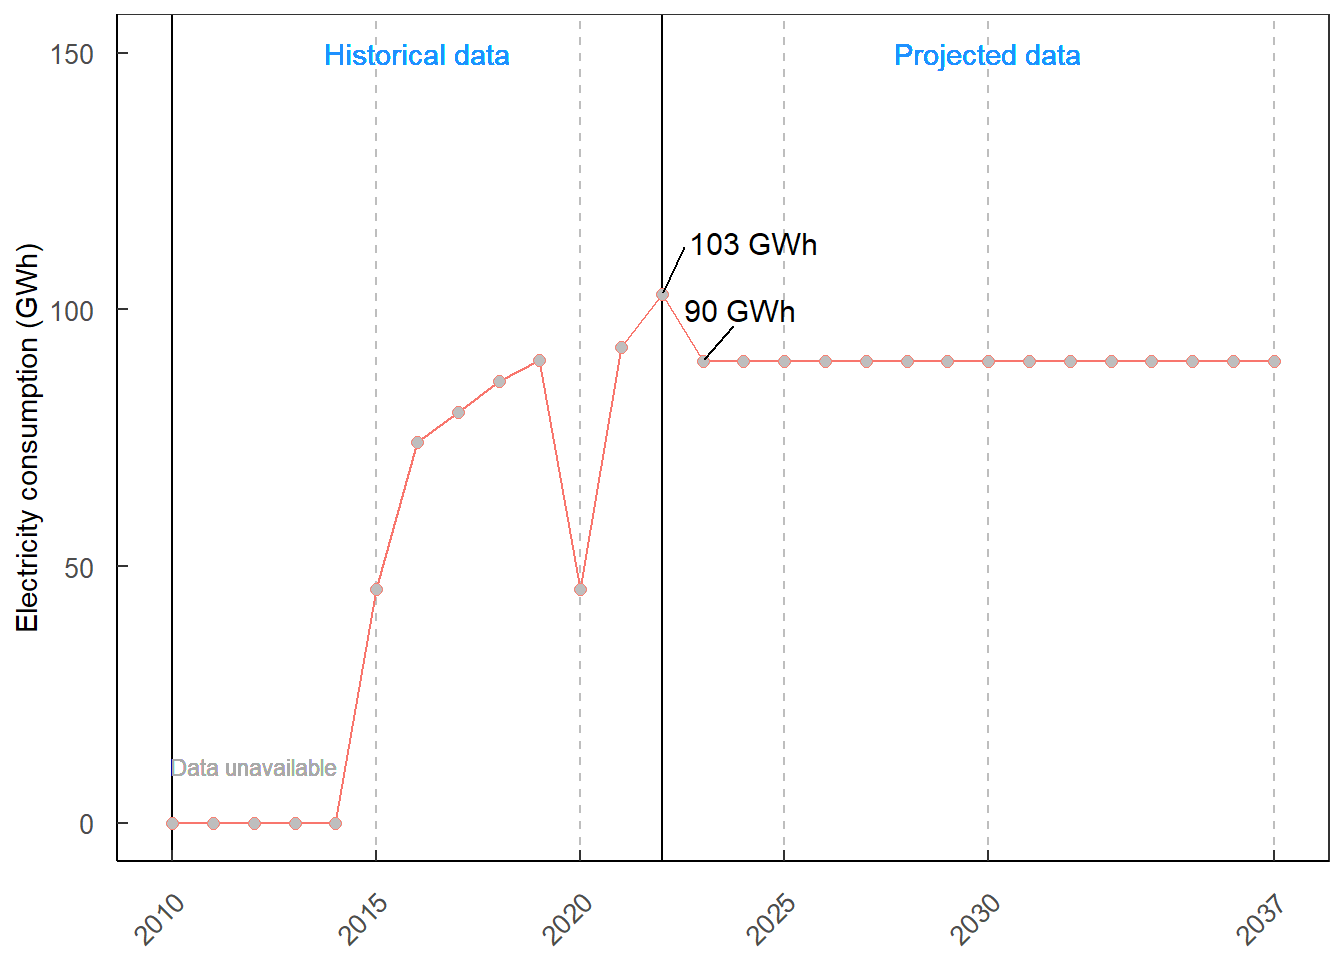
Figure 8.3: Electricity consumption in station service (off-load)
8.4 Electricity consumption in Mae Moh mining
The data is extracted from 01 EGAT_20Oct2022_งบ66 67_Final.xlsx. The R code chuck is given below.
use_maemoh <-

  read_excel("raw_data/01 EGAT_20Oct2022_งบ66 67_Final.xlsx",
             sheet = "C_LossUse",
             range = "C149:D176",
             col_names = c("year_th", "ely_gwh")) %>%
  mutate(year = year_th - 543)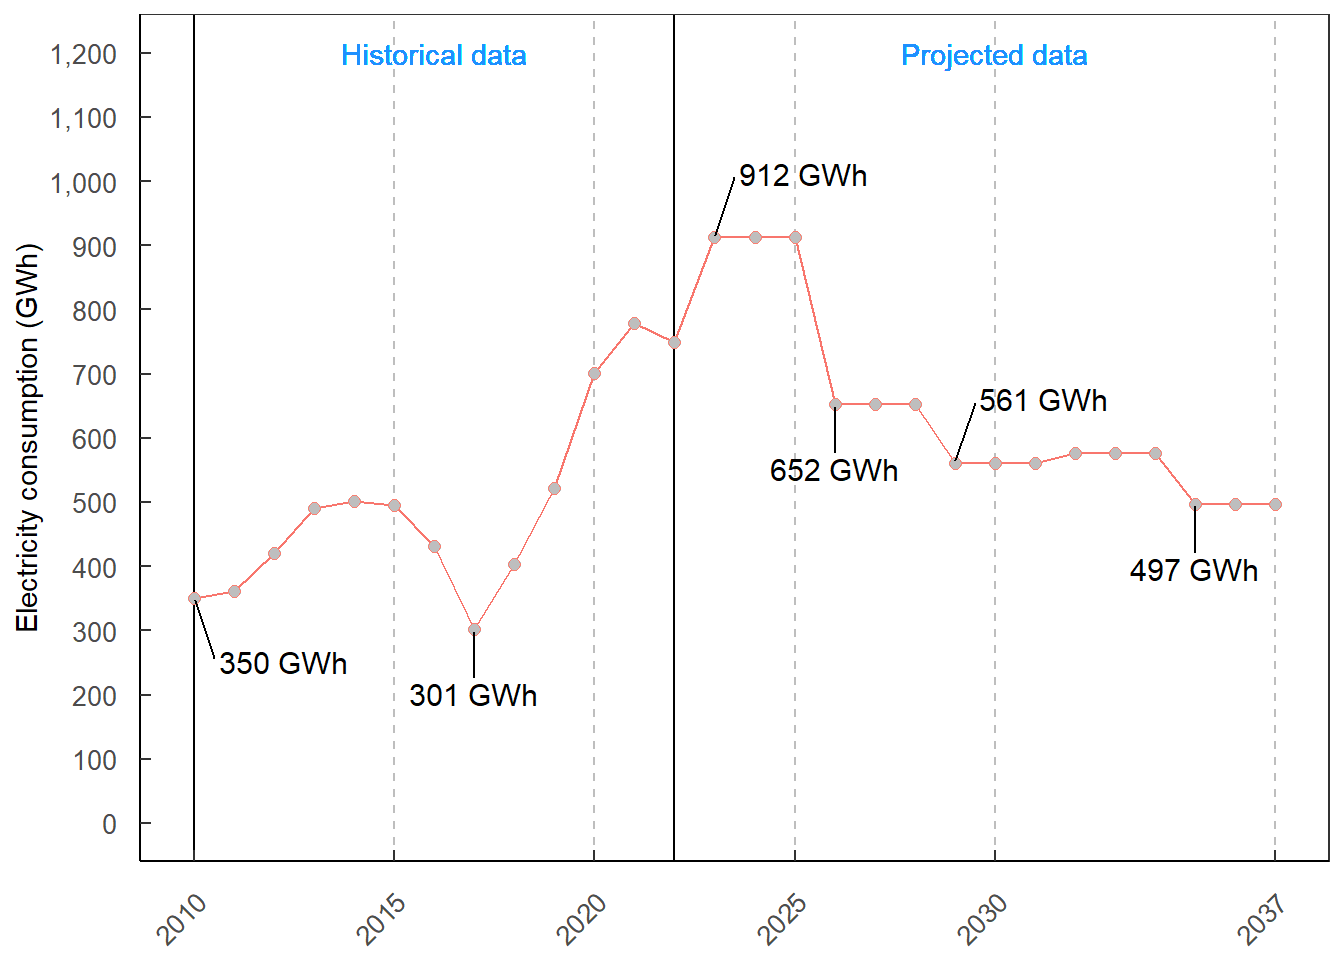
Figure 8.4: Electricity consumption in Mae Moh mining
8.5 Electricity consumption in pumped storage hydropower plants
The data is extracted from 01 EGAT_20Oct2022_งบ66 67_Final.xlsx. The R code chuck is given below.
use_pump <-

  read_excel("raw_data/01 EGAT_20Oct2022_งบ66 67_Final.xlsx",
             sheet = "C_LossUse",
             range = "C190:D217",
             col_names = c("year_th", "ely_gwh")) %>%
  mutate(year = year_th - 543)
As of August 2023, there are 3 EGAT’s pumped storage hydropower plants as follows:
- Srinagarind pumped storage hydropower plant unit 4 and 5, Kanchanaburi with 360 MW of installed capacity;
- Bhumibol pumped storage hydropower plant unit 8, Tak with 171 MW of installed capacity; and
- Lamtakong pumped storage hydropower plant, Nakorn Ratchasima with 1,000 MW of installed capacity
The Chulabhorn pumped storage hydropower plant is currently under an Environmental Impact Assessment (EIA). The plant’s commercial operation date (COD) would be in 2034 with 800 MW of installed capacity.
An electricity consumption by pumped storage hydropower plants increased from 434 GWh in 2010 and reached it peak 610 GWh in 2020. Power System Control and Operation Division (ฝ่ายควบคุมระบบกำลังไฟฟ้า (อคฟ.)) estimates a yearly operation short- and a long-term plans. It is estimated that the electricity consumption would be 555 GWh in 2023 until 2037 (see Figure 8.5). It accounts only the electricity consumption in the Lamtakong pumped storage hydropower plant.
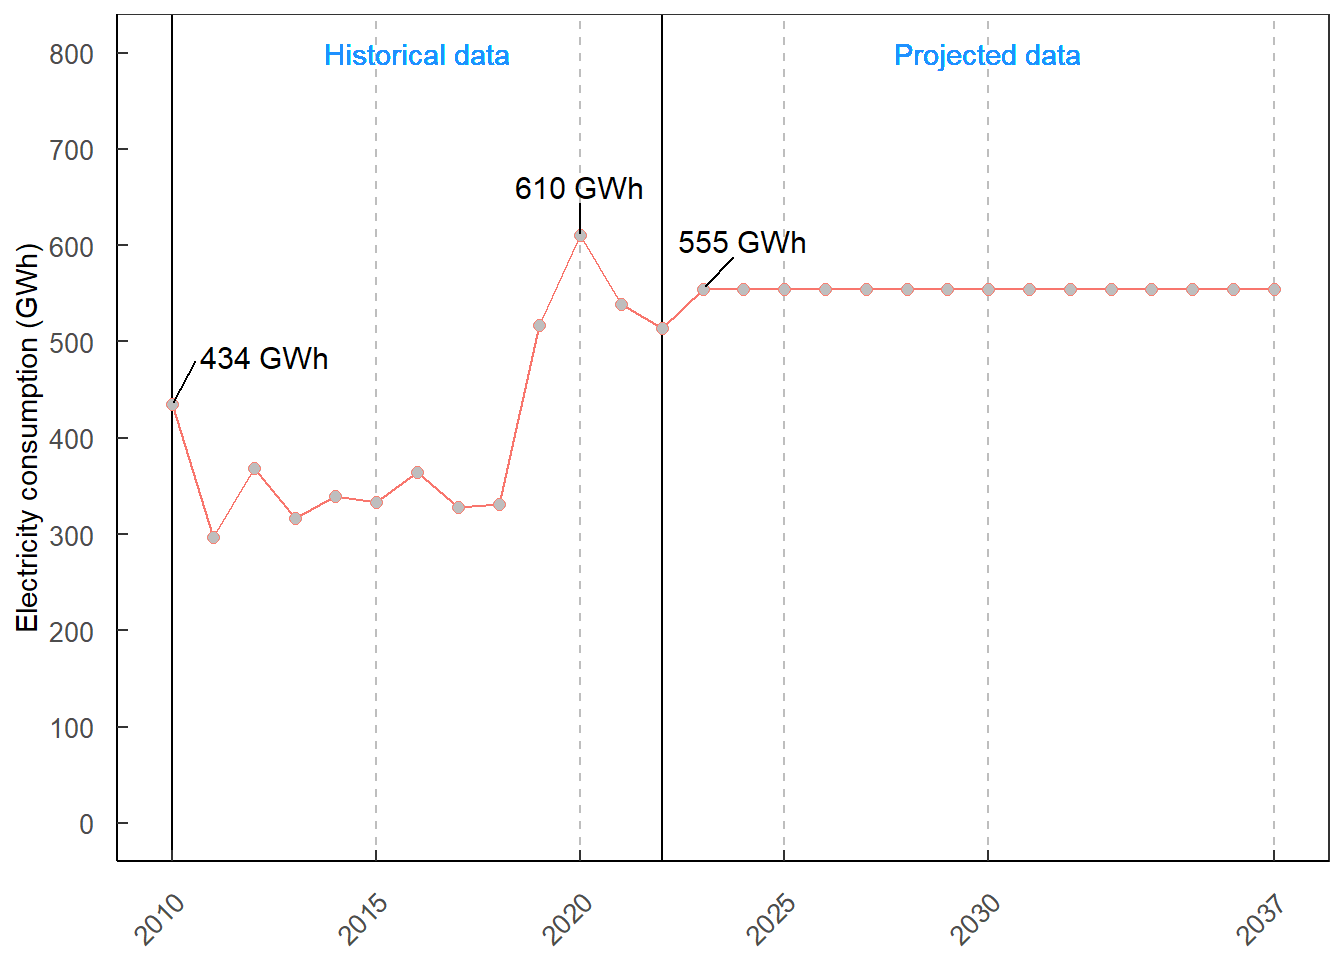
Figure 8.5: Electricity consumption by pumped storage hydropower plants
8.6 Total EGAT internal electricity consumption
Total EGAT internal electricity consumption can be found in equation (8.1).
\[\begin{align*} TOTUSEPUMP_{t} = & ELY_{headoffice,t}+ELY_{substation,t}+ELY_{stationserv,t}+\\ & ELY_{maemoh,t}+ELY_{pump,t} \tag{8.1} \end{align*}\]
Where,
\(TOTUSEPUMP_{t}\) denotes total EGAT internal electricity consumption in year \(t\).
\(ELY_{headoffice}\) denotes an electricity consumption in EGAT head office and others in year \(t\) (see section 8.1).
\(ELY_{substation}\) denotes an electricity consumption in EGAT substations in year \(t\) (see section 8.2).
\(ELY_{stationserv,t}\) denotes an electricity consumption in EGAT station services in year \(t\) (see section 8.3).
\(ELY_{maemoh,t}\) denotes an electricity consumption in EGAT Mae Moh mining in year \(t\) (see section 8.4).
\(ELY_{pump,t}\) denotes an electricity consumption in EGAT pumped storage hydropower plants in year \(t\) (see section 8.5).
total_usepump <-

  use_office %>%
  select(year, use_office = ely_gwh) %>%
  mutate(use_egatsub  = use_egatsub$ely_gwh,
         use_statserv = use_statserv$ely_gwh,
         use_maemoh   = use_maemoh$ely_gwh,
         use_pump     = use_pump$ely_gwh,
         total_usepump  = use_office + use_egatsub + use_statserv + use_maemoh + use_pump)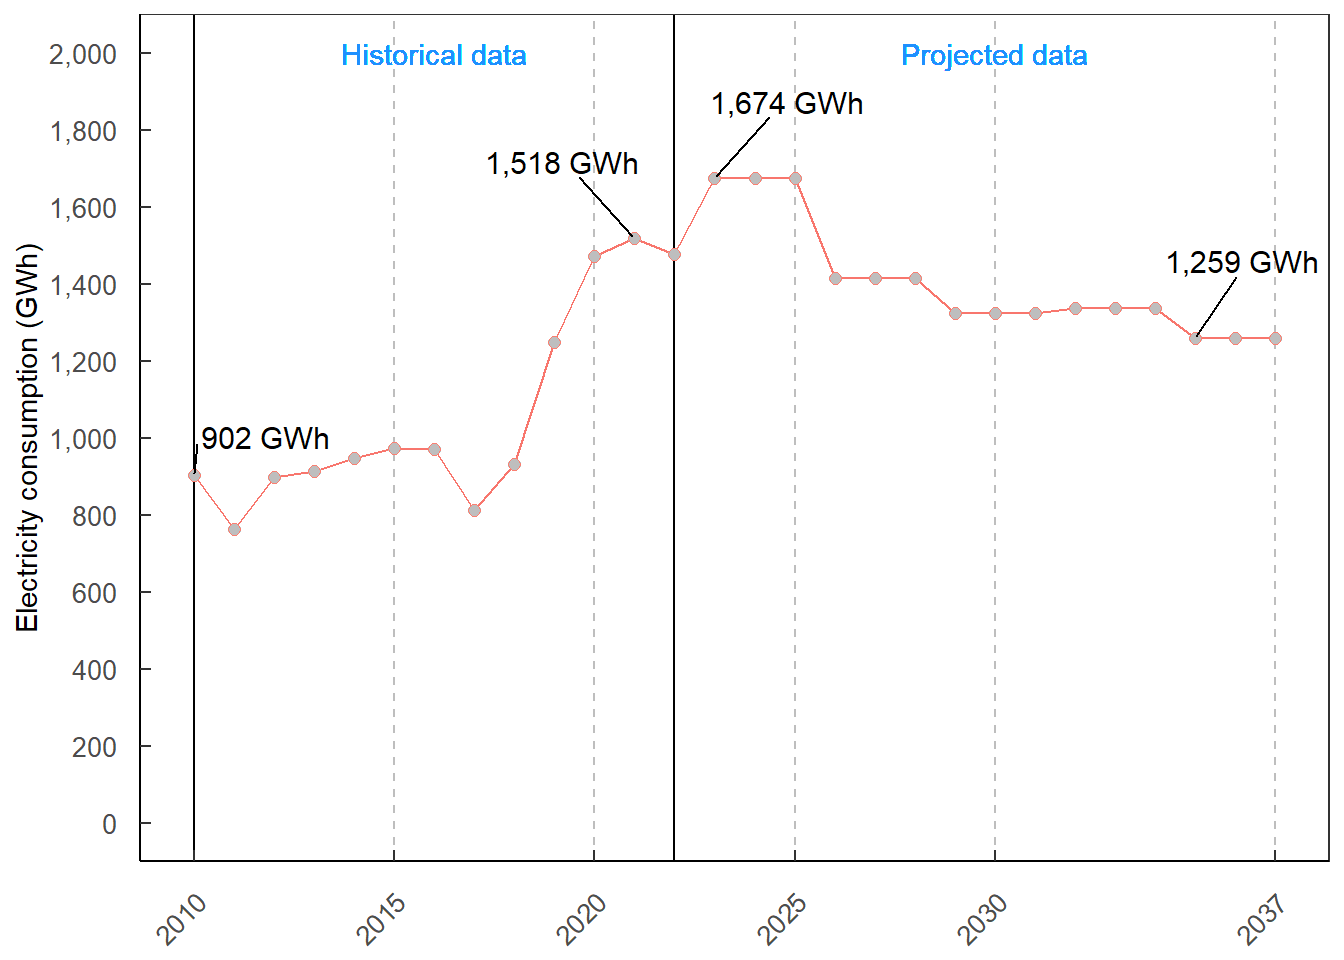
Figure 8.6: Total EGAT internal electricity consumption
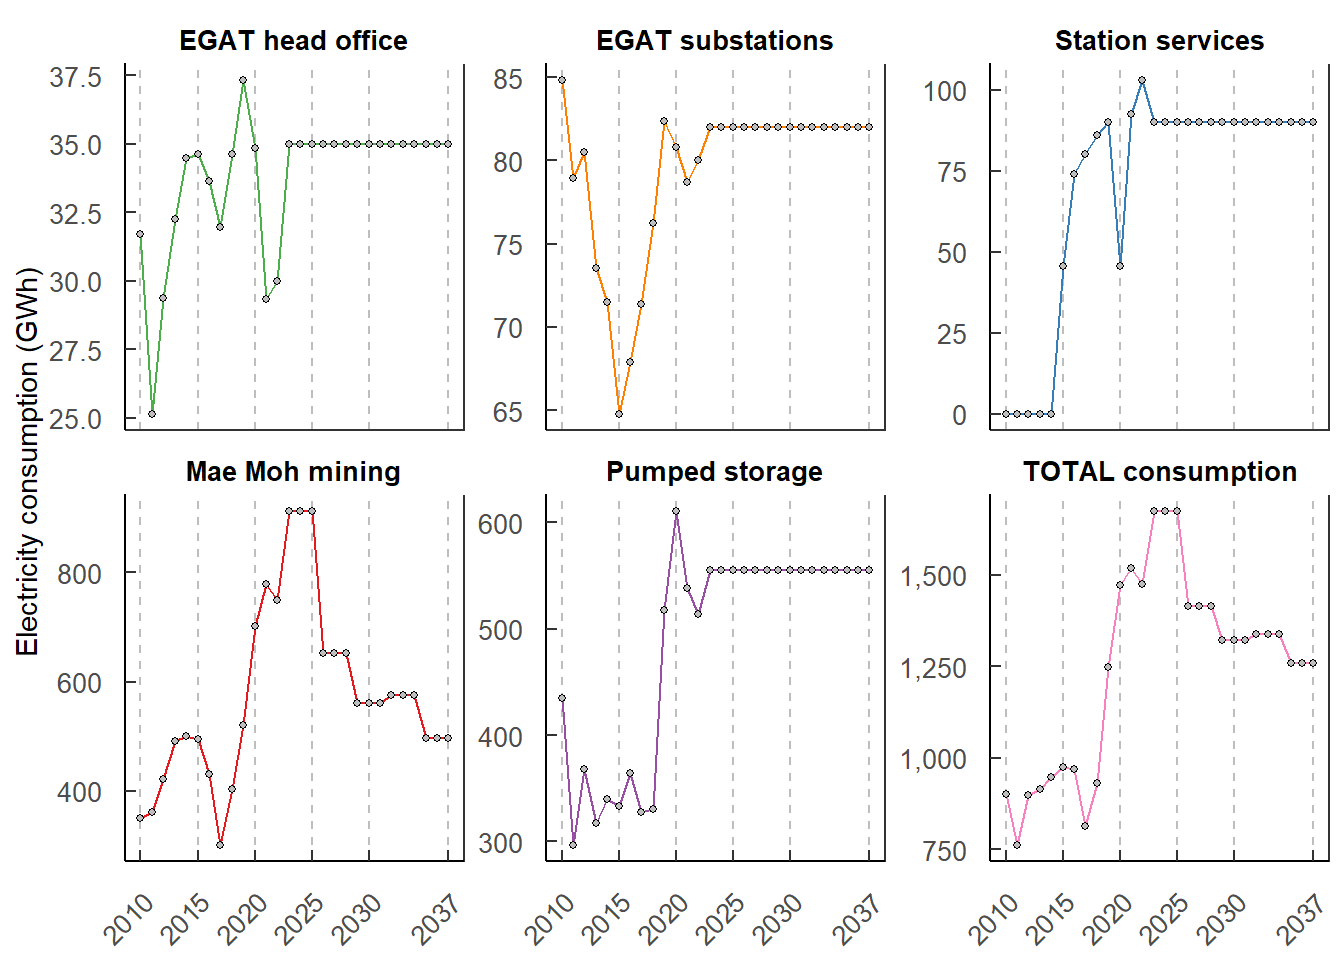
Figure 8.7: Total EGAT electricity consumption by categories