Chapter 6 Very small power producer (VSPP) situation
6.1 Electricity generation from VSPP in the MEA
In MEA, the electricity are produced by:
- Solar
- Municipal solid waste (MSW)
- Small hydro
- Co-generation
According to MEA data, the electricity generation is available from 1997-2021 (budget load as of 20 Oct 2022).
mea_vspp_ene_ext <-

read_excel("raw_data/01 EGAT_20Oct2022_งบ66 67_Final.xlsx",
           sheet = "I_Actual",
           range = "CE7:CM31",
           col_names = c("solar", "wind", "biomass", "biogas", "msw", "hydro", "enecrop", "cogen", "tot_vspp_gwh")) %>%
  replace(is.na(.),0) %>%
  mutate(year = 1997:2021,
         year_th = year + 543) %>%
  select(year, year_th,everything()) %>%
  pivot_longer(-year&-year_th, names_to = "fuel", values_to = "mea_vspp_gwh")
Electricity generation from VSPP in the MEA region is provided by the Load Forecast committee. The data is available from 2005. There is no electricity generation from biogas, biomass, energy crop, and wind in MEA region. Total electricity generation from VSPP substantially increased from 3 MWh in 2005 to 316 GWh in 2021. Municipal solid waste (MSW) and solar played vital roles in generating an electricity (see Figure 6.1).
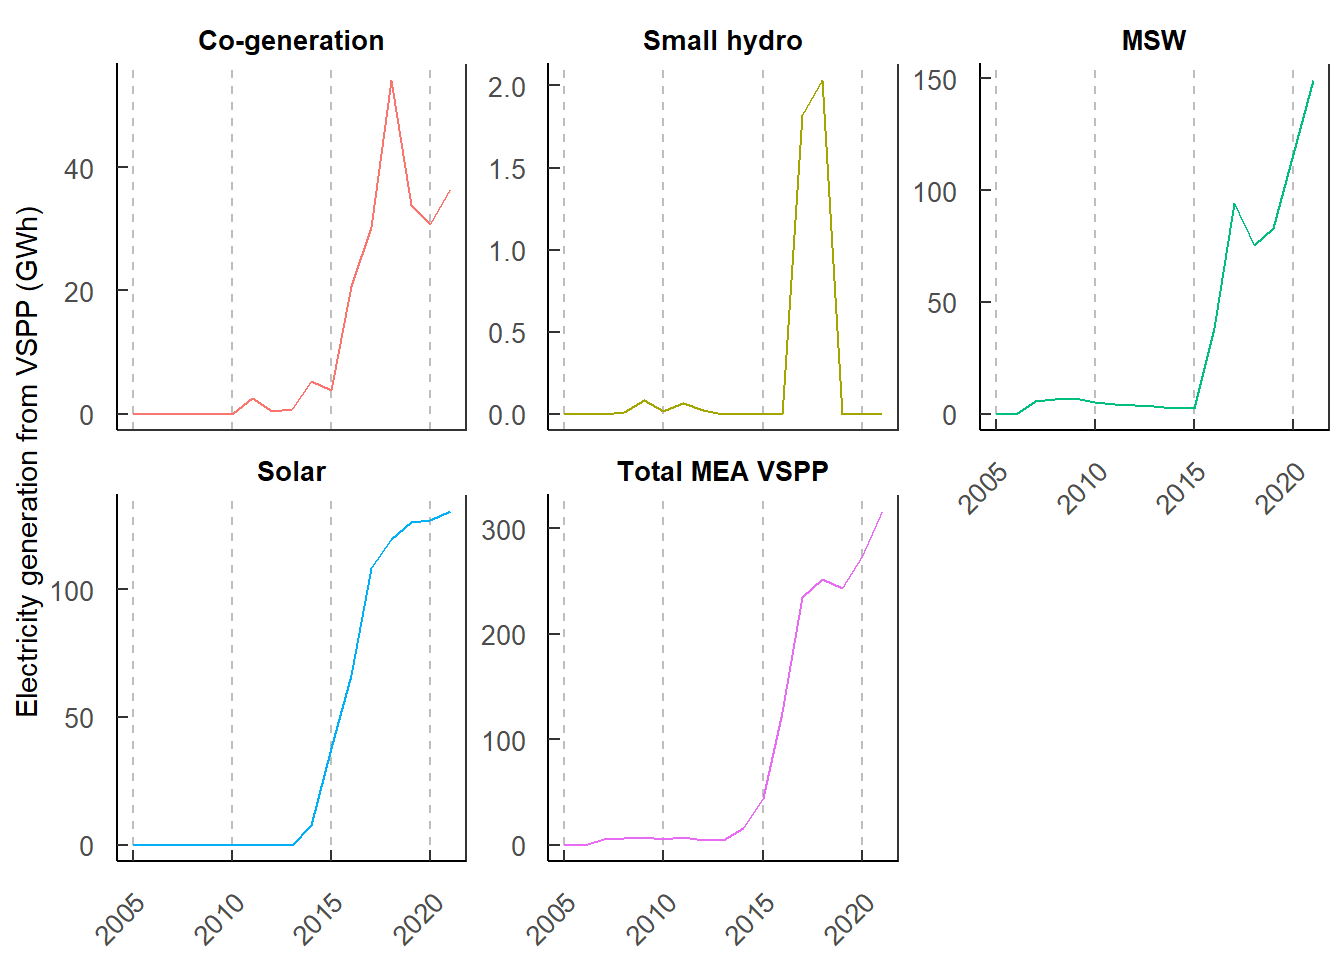
Figure 6.1: Electricity generation from VSPP in MEA region during 2005–2021.
6.2 Electricity generation from VSPP in the PEA
In PEA, the electricity are produced by:
- Solar
- Solar rooftop
- Wind
- Biomass
- Biogas
- Municipal solid waste (MSW)
- Small hydro
- Co-generation
A R code chunk to analyze the electricity generation from VSPP in the PEA is given below.
pea_vspp_ene_ext <-

  read_excel("raw_data/01 EGAT_20Oct2022_งบ66 67_Final.xlsx",
           sheet = "I_Actual",
           range = "DK7:DT31",
           col_names = c("solar","pvrftop", "wind", "biomass", "biogas", "msw", "hydro", "enecrop", "cogen", "tot_vspp_gwh"))%>%
  replace(is.na(.),0) %>%
  mutate(year = 1997:2021,
         year_th = year + 543,
         slr_and_rftop = solar + pvrftop) %>%
  select(year, year_th,slr_and_rftop,everything(), -solar,-pvrftop) %>%
  pivot_longer(-year&-year_th, names_to = "fuel", values_to = "pea_vspp_gwh")
Total electricity generation from VSPP substantially increased from 14 GWh in 2005 to 1.1324^{4} GWh in 2021. Biomass played a vital role in generating an electricity in PEA during 2005-2021. Solar and solar rooftop was exponentially increased from 2010-2017 and saturated from 2018 onwards (see Figure 6.2: Solar & solar rooftop). Wind electricity ramped up from 1 GWh in 2008 to 79 GWh in 2021 (see Figure 6.2: Wind).
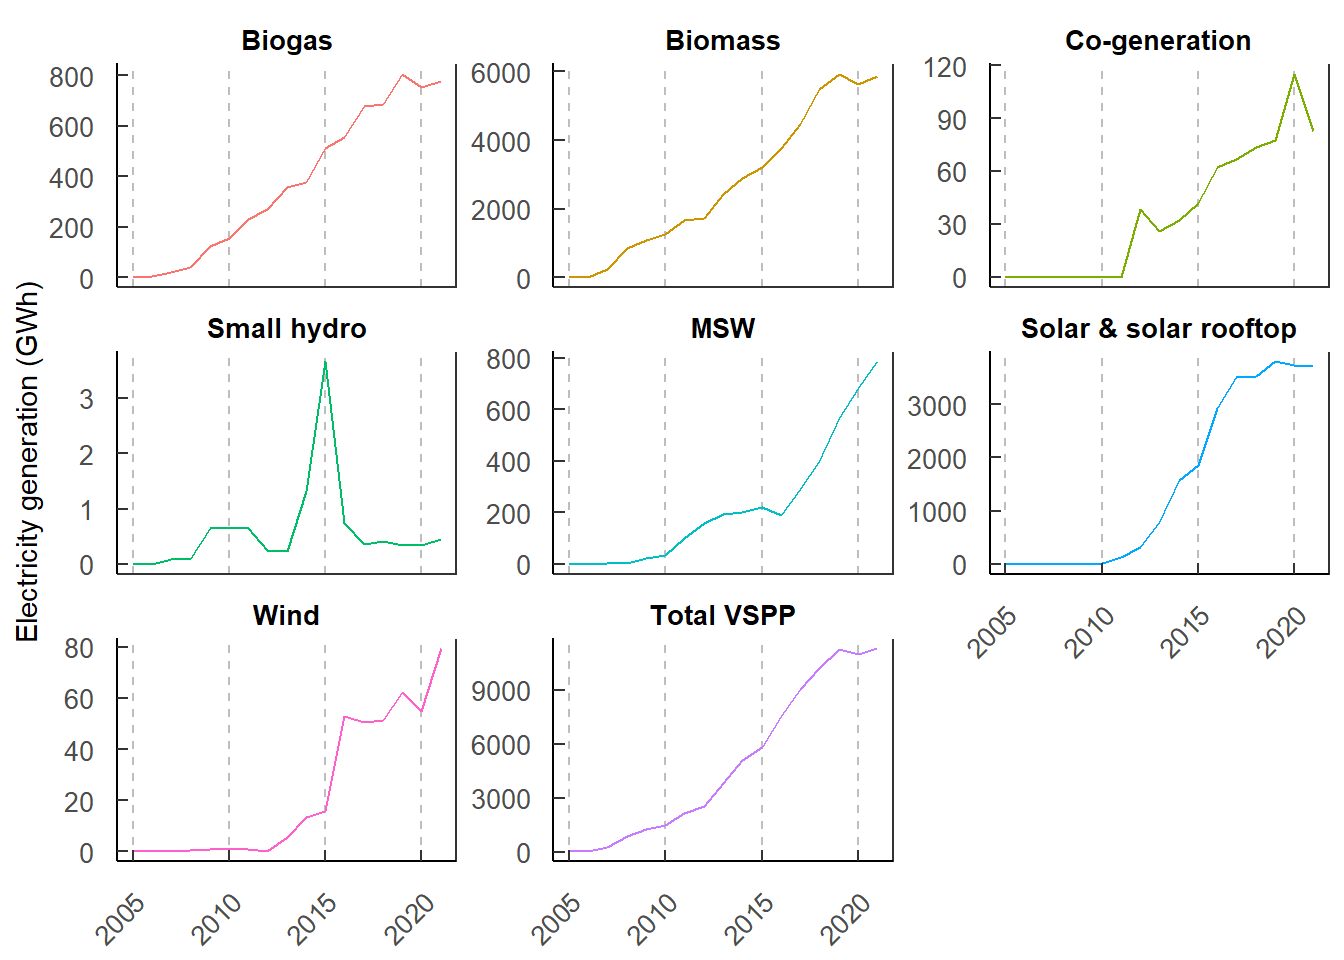
Figure 6.2: Electricity generation from VSPP in PEA region during 2005–2021.
6.3 Electricity generation from DEDE in the PEA
A R code chunk to analyze the electricity generation from DEDE in the PEA is given below.
Electricity generation from DEDE is provided small hydro power plants. Total electricity generation from DEDE substantially increased from 83 GWh in 2005 and reach its peak 109 GWh in 2017. The generation sharply fell to 71 GWh in 2021 (see Figure 6.3).
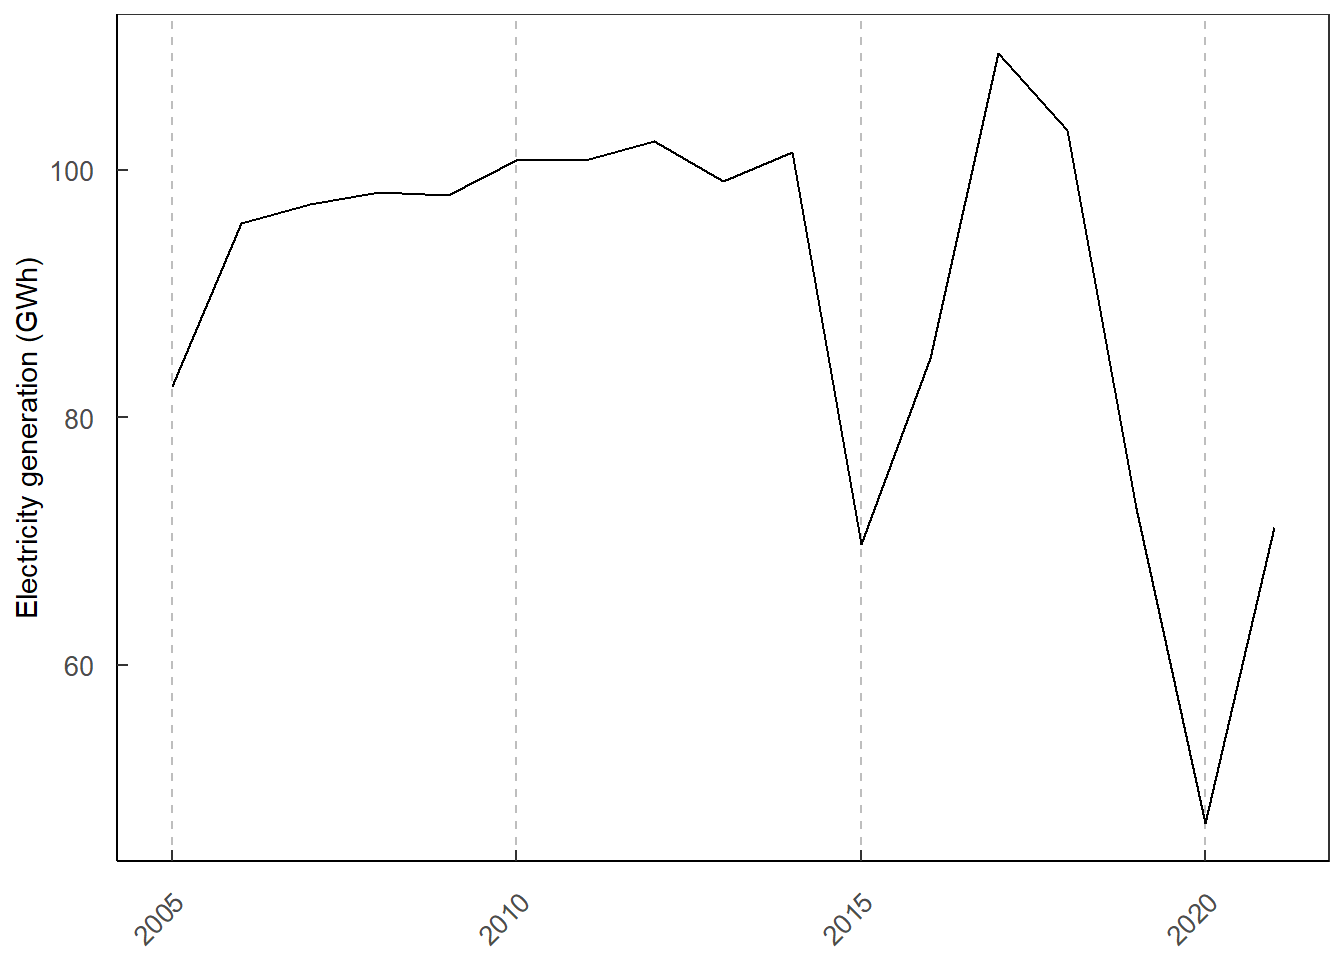
Figure 6.3: Electricity generation from DEDE in PEA region during 2005–2021.
6.4 Self electricity generation in the PEA
A R code chunk to analyze the self electricity generation in the PEA is given below.
pea_sfgen_ene <-

read_excel("raw_data/01 EGAT_20Oct2022_งบ66 67_Final.xlsx",
           sheet = "I_Actual",
           range = "EZ7:EZ31",
           col_names = "pea_sfgen_gwh") %>%
  mutate(year = 1997:2021,
         year_th = year +543)
Self electricity generation in the PEA is contributed by small hydro, solar, wind, and diesel generators. Total electricity generation from DEDE substantially increased from 44 GWh in 2005 and reach its peak 126 GWh in 2018. The generation fell to 92 GWh in 2021 (see Figure 6.4).
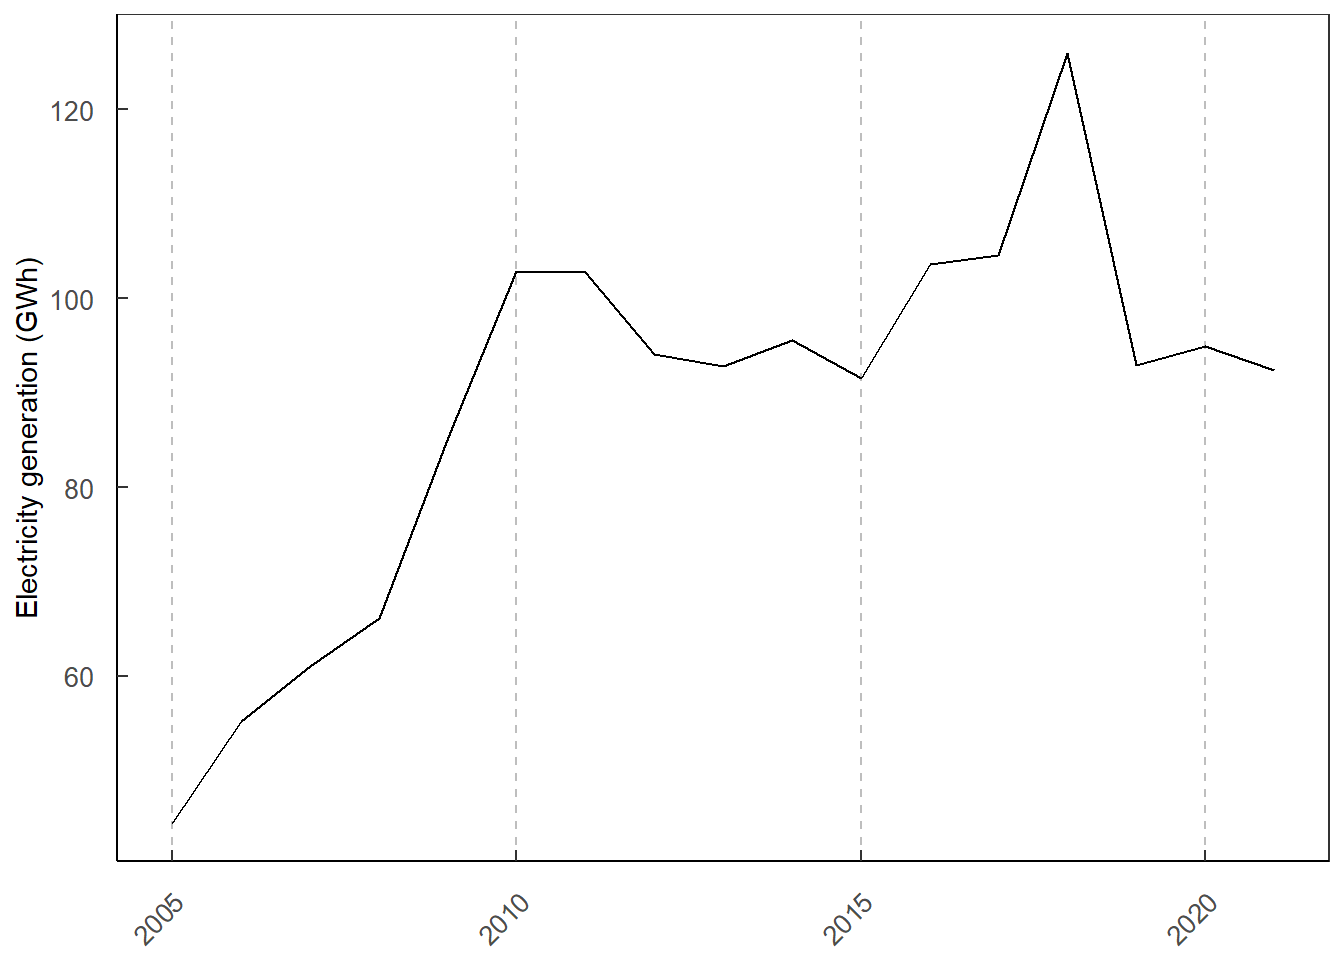
Figure 6.4: Self electricity generation in PEA region during 2005–2021.
6.5 Total electricity generation from VSPP
Total electricity generation can be calculated by equation (6.1).
\[\begin{equation} EVSPP_{i,t} = EVSPP_{MEA,t} + (EVSPP_{PEA,t}+EVSPP_{DEDE,t}+EVSPP_{Selfgen,t}) \tag{6.1} \end{equation}\]
Where,
\(EVSPP_{i,t}\) denotes total electricity generation by VSPP from region \(i\) in year \(t\).
\(EVSPP_{MEA,t}\) denotes total electricity generation by VSPP from \(MEA\) in year \(t\) (see section 6.1).
\(EVSPP_{PEA,t}\) denotes an electricity generation by VSPP from \(PEA\) in year \(t\) (see section 6.2).
\(EVSPP_{DEDE,t}\) denotes an electricity generation by \(DEDE\) from PEA in year \(t\) (see section 6.3).
\(EVSPP_{Selfgen,t}\) denotes a self electricity generation (\(Selfgen\)) from PEA in year \(t\) (see section 6.4).
A R code chunk to analyze total electricity generation is given below.
tot_vspp_ext <-
cbind(mea_vspp_ene_ext %>%
        filter(year >= 2015,
               fuel == "tot_vspp_gwh") %>%
        select(year, year_th, mea_vspp_gwh),
      pea_vspp_ene_ext %>%
        filter(year >= 2015,
               fuel == "tot_vspp_gwh") %>%
        select(pea_vspp_gwh),
      pea_dede_ene %>%
        filter(year >= 2015) %>%
        select(pea_dede_gwh),
      pea_sfgen_ene %>%
        filter(year >= 2015) %>%
        select(pea_sfgen_gwh)
        ) %>%
  mutate(tot_pea_vspp_gwh = pea_vspp_gwh + pea_dede_gwh + pea_sfgen_gwh,
         tot_vspp_ext_gwh = mea_vspp_gwh + pea_vspp_gwh + pea_dede_gwh + pea_sfgen_gwh) %>%
  pivot_longer(-year&-year_th,names_to = "vspp",values_to = "ene_vspp_ext_gwh")
Figure 6.5 illustrates total electricity generation from VSPP during 2015-2021. Total electricity generation from VSPP sharply increased from 6054 GWh in 2015 to 1.1803^{4} GWh in 2021. The PEA mainly drove the generation by VSPP.
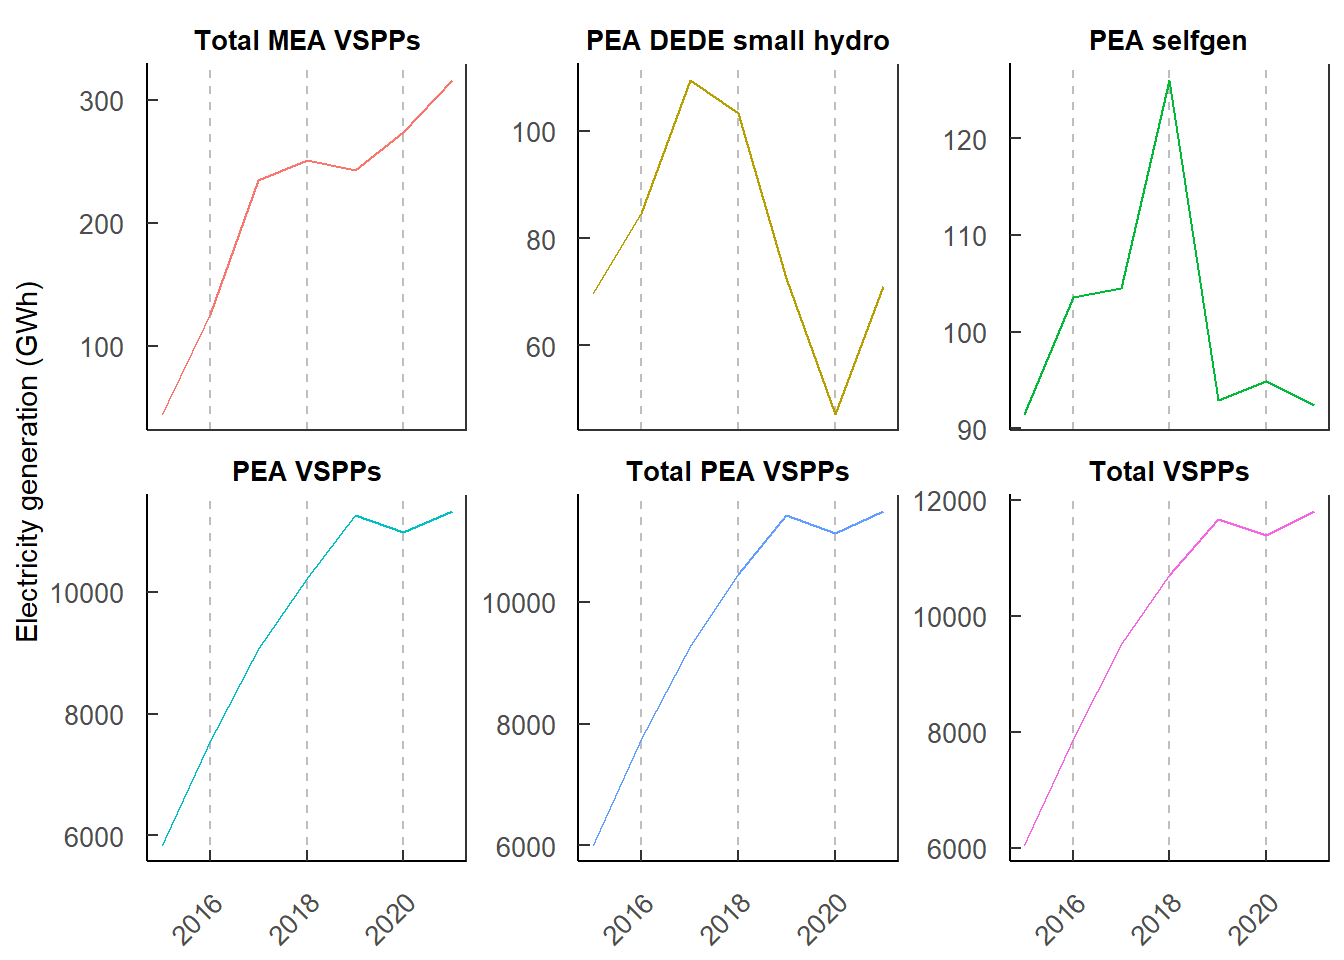
Figure 6.5: Electricity generation from VSPP during 2015–2021.