Chapter 11 MEA and PEA electricity requirement
This section provides an electricity requirement from MEA and PEA.
The electricity requirement from the MEA and the PEA areas can be calculated by following equation:
\[\begin{equation} ELYREQ_{r,t} = ELYCON_{r,t} + ELYLSS_{r,t} \tag{11.1} \end{equation}\]
Where,
\(ELYREQ_{r,t}\) denotes an electricity requirement in region \(r\) in year \(t\).
\(ELYCON_{r,t}\) denotes an electricity consumption in region \(r\) in year \(t\).
\(ELYLSS_{r,t}\) denotes an electricity loss in region \(r\) in year \(t\).
11.1 MEA actual electricity requirement
Electricity requirement, consumption and loss are given by staff in the MEA. A R code chunk is provided below.
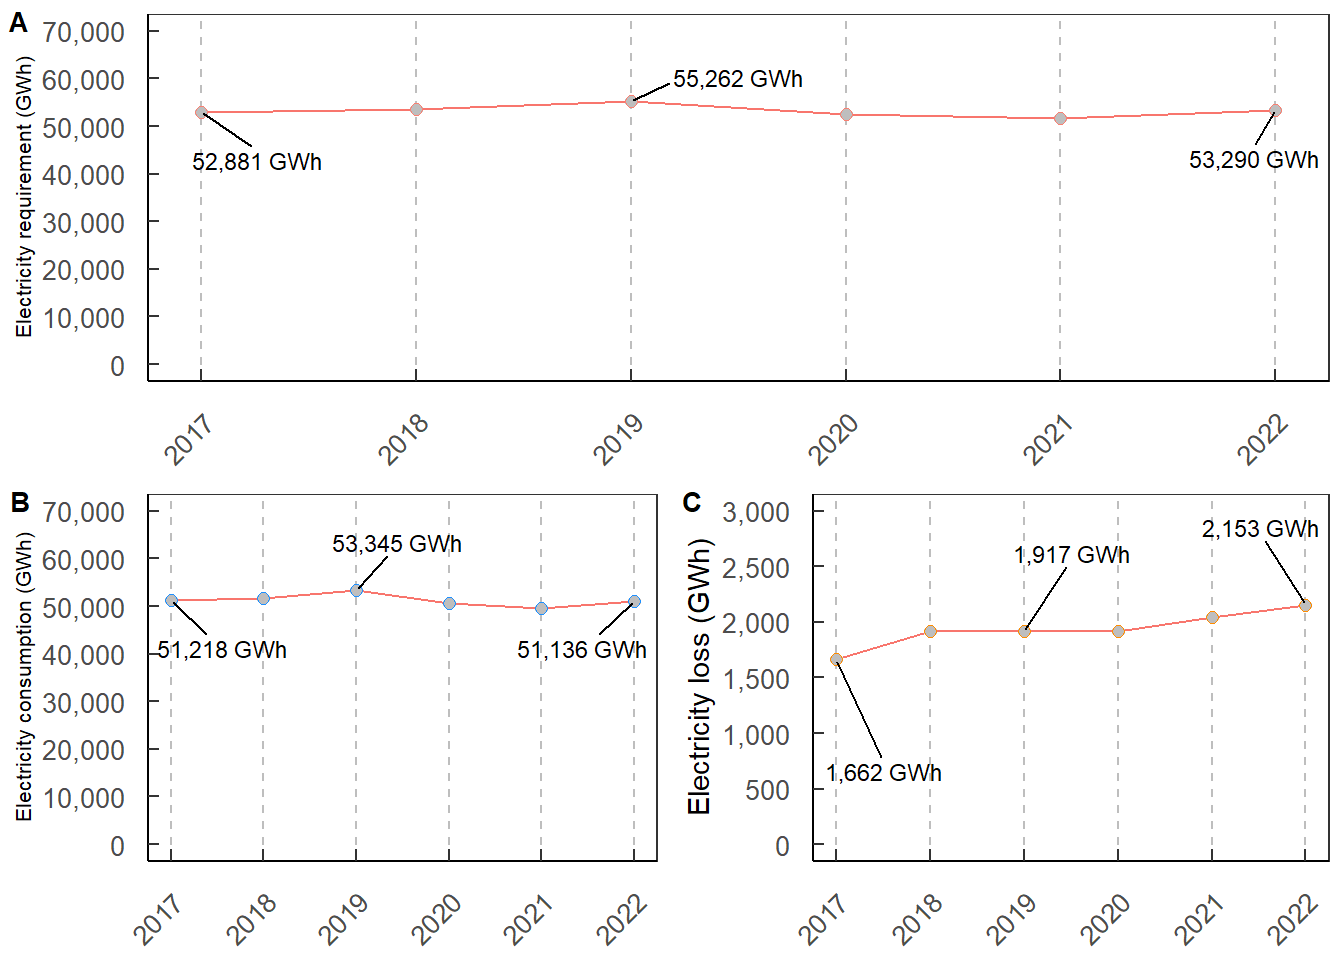
A 2022 electricity requirement in the MEA area is required (mea_ene_latest). The code is used in the script named mea_ene_cal.R. In 2022, the MEA electricity requirement was 53,290.55 GWh (see figure 11.1A). This information is used as an input for the MEA’s electricity requirement calculation in the worst case. A R code chunk is given below.
## [1] 53290.55An actual MEA’s electricity requirement is collected from 2017-2022. The requirement increased from 52,881 GWh in 2017 to 53,291 GWh in 2022 (see Figure 11.1A). There was a significant drop in 2020 and 2021 due a Covid-19 pandemic. In 2022, the electricity requirement rebounded similar to those in 2018. Total electricity consumption is similar to the requirement (see Figure 11.1B). An electricity loss in a MEA system gradually increased (see Figure 11.1C).

Figure 11.1: Total electricity requirement, consumption and loss in the MEA area
An electricity consumption in the MEA area is divided into 9 categories as follows:
- Residences
- Small general services
- Medium general services
- Large general services
- Specific business
- Non profit organization
- Temporary electricity consumption
- Street lighting
- ไฟทำการ
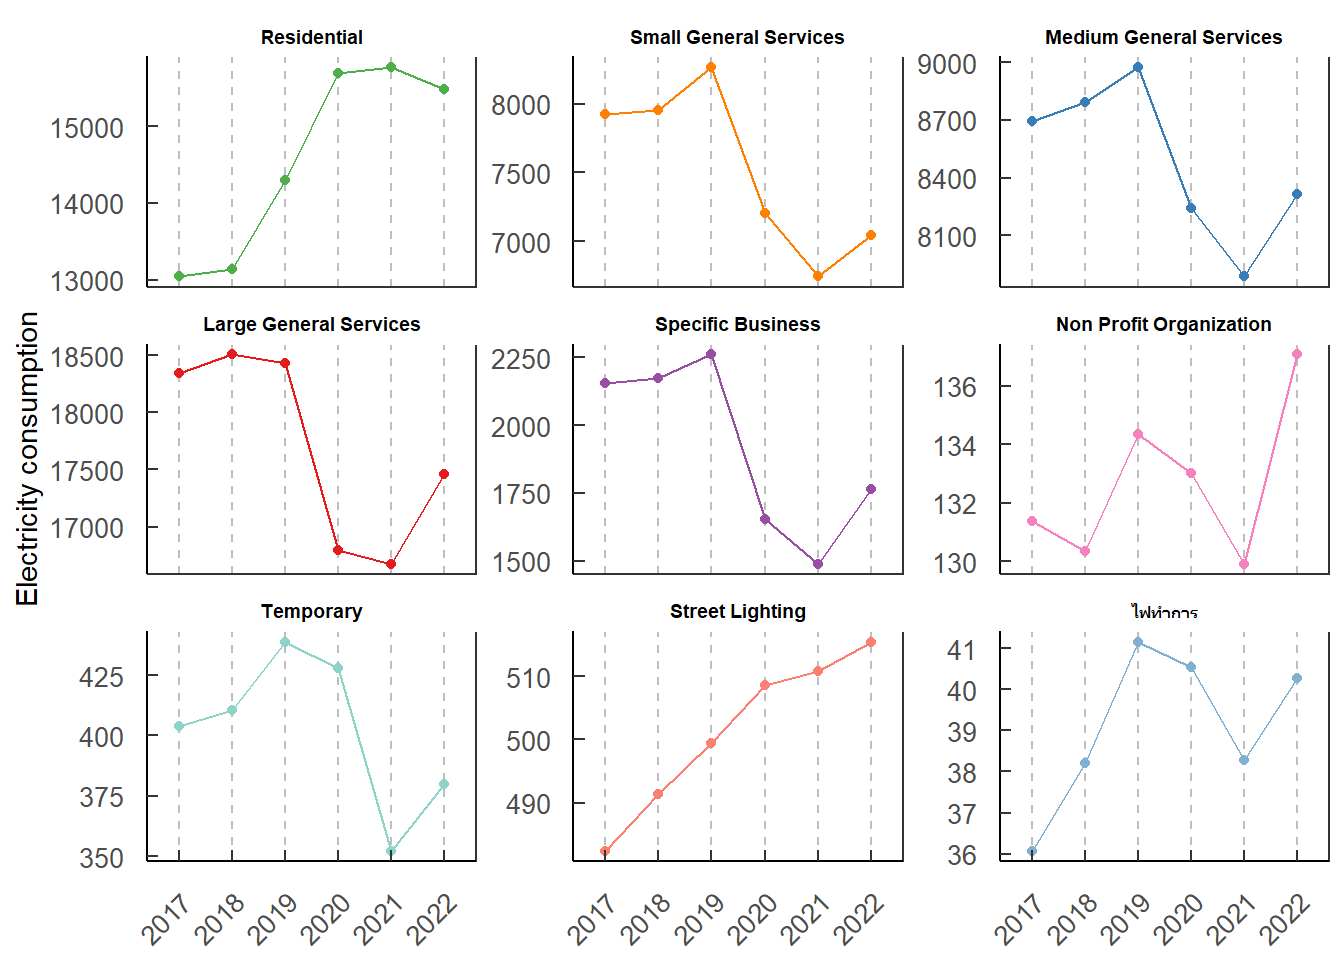
Figure 11.2 illustrates a sector-wise electricity consumption in the MEA area. During the pandemic, the electricity consumption reduced in all sectors during 2020-2021 excepted for street lighting. Organizations launched a work from home (WFH) program. An electricity consumption in a residential sector significantly raised. The pandemic eased up in 2022. The consumption recovered.

Figure 11.2: Sector-wise electricity consumption in the MEA area
11.2 PEA actual electricity requirement
An electricity requirement, consumption and loss is given by staff from the PEA. A R code chunk is provided below.
pea_ene_ext <-
read_excel("raw_data/01 EGAT_20Oct2022_งบ66 67_Final_Sent อศง.xlsx",
           sheet = "PEA",
           range = "A41:N56",
           col_names = c("category","a", 2017:2028)) %>%
  select(!a) %>%
  pivot_longer(-category, names_to = "year", values_to = "pea_gwh") %>%
  filter(category == "ความต้องการพลังงานไฟฟ้าในระบบไฟฟ้า กฟภ.") %>%
  mutate(year = as.numeric(year),
         year_th = year + 543) %>%
  select(year_th, year, pea_gwh, !category) %>%
  filter(year %in% c(2017:2022))
A 2022 electricity requirement in the PEA area is required (pea_ene_latest). The code is used in the script named pea_ene_cal.R. In 2022, the PEA electricity requirement was 152,895.8 GWh. This information is used as an input for a PEA’s electricity requirement calculation in the worst case. A R code chunk is given below.
## [1] 152895.8An actual PEA’s electricity requirement is collected from 2017-2022. Electricity requirements are as follows (see equation (11.1)):
- Electricity consumption
- Electricity generation from IPS
- Electricity loss
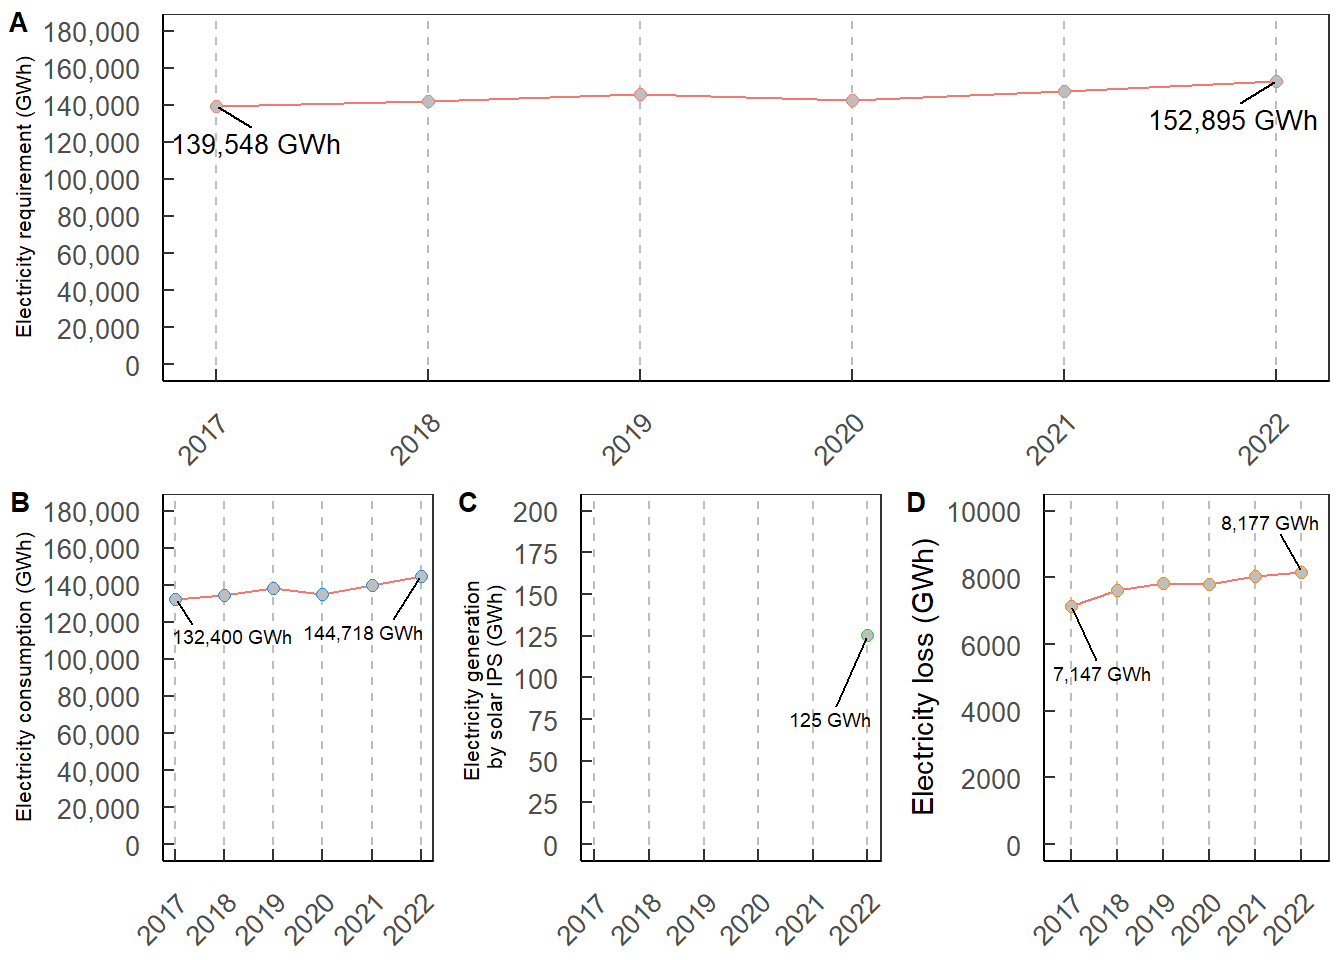
The requirement increased from 139,548 GWh in 2017 to 152,895.8 GWh in 2022 (see Figure 11.3A). The requirement and consumption slightly declined in 2020 due to a Covid-19 pandemic. The consumption rebounded in 2021 (see Figure 11.3B).
Solar electricity generation from IPS was 125 GWh in 2022 (see Figure 11.3C).
The electricity loss continuously increased from 7,147 GWh in 2017 to 8,177 GWh in 2022. PEA’s electricity loss was moderately increased from 2017-2022 (see Figure 11.3D).

Figure 11.3: Total electricity requirement, consumption, solar IPS and loss in PEA regions
Electricity consumption in PEA areas is divided into 9 categories as follows:
- Residences
- Small general services
- Medium general services
- Large general services
- Specific business
- Non profit organization
- Pumped in agriculture
- Temporary electricity consumption
- Free of charge customer
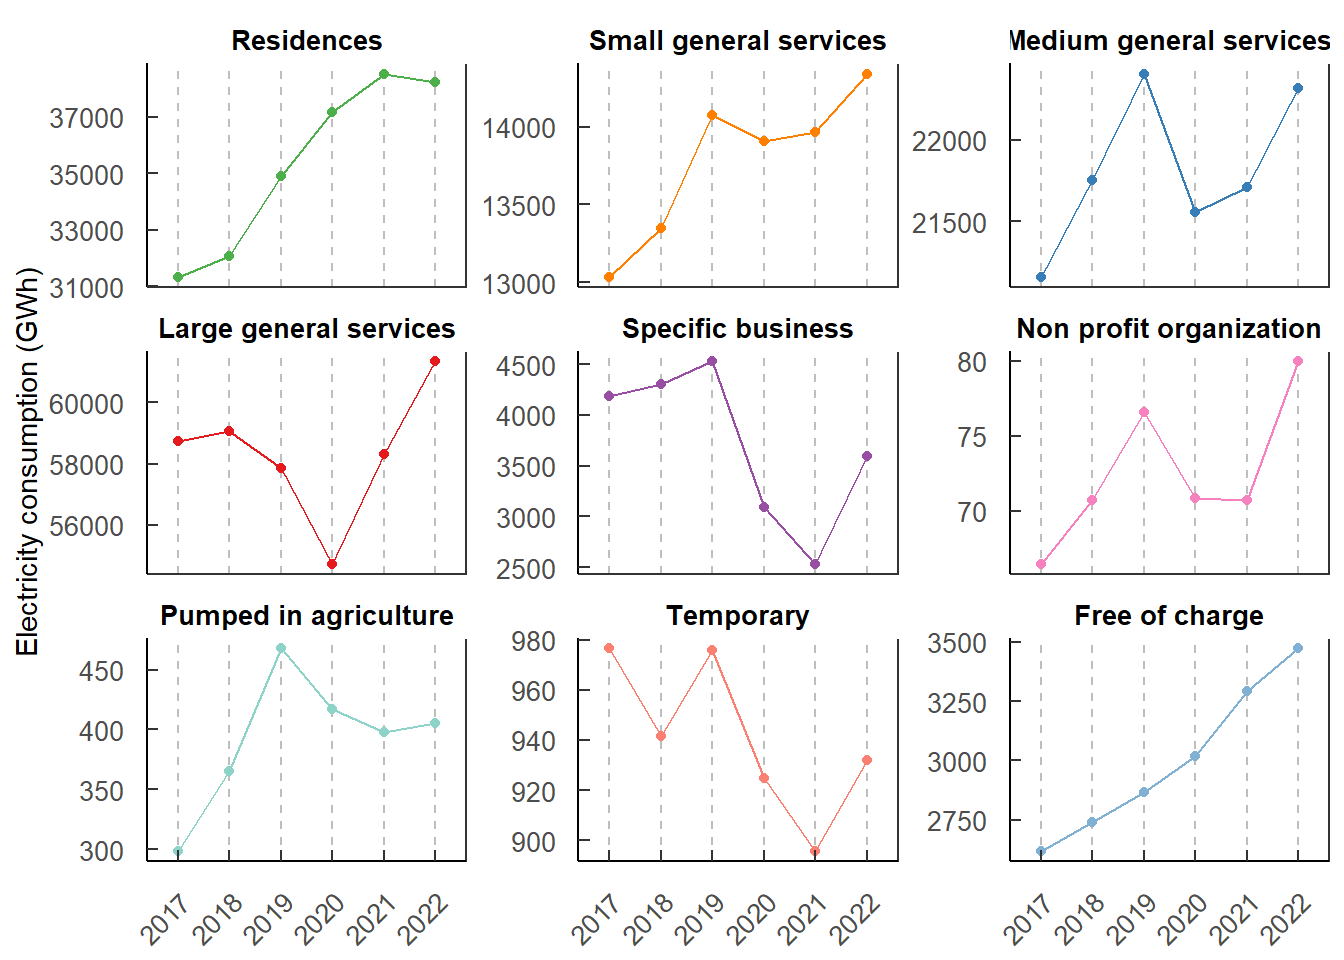
Figure 11.4 illustrates a sector-wise electricity consumption in PEA region. During the pandemic, the electricity consumption reduced in all sectors during 2020-2021 excepted for a consumption in free of charge customers. Organizations launched a work from home (WFH) program. An electricity consumption in a residential sector significantly raised. The pandemic eased up in 2022. The consumption recovered.

Figure 11.4: Sector-wise electricity consumption in PEA regions