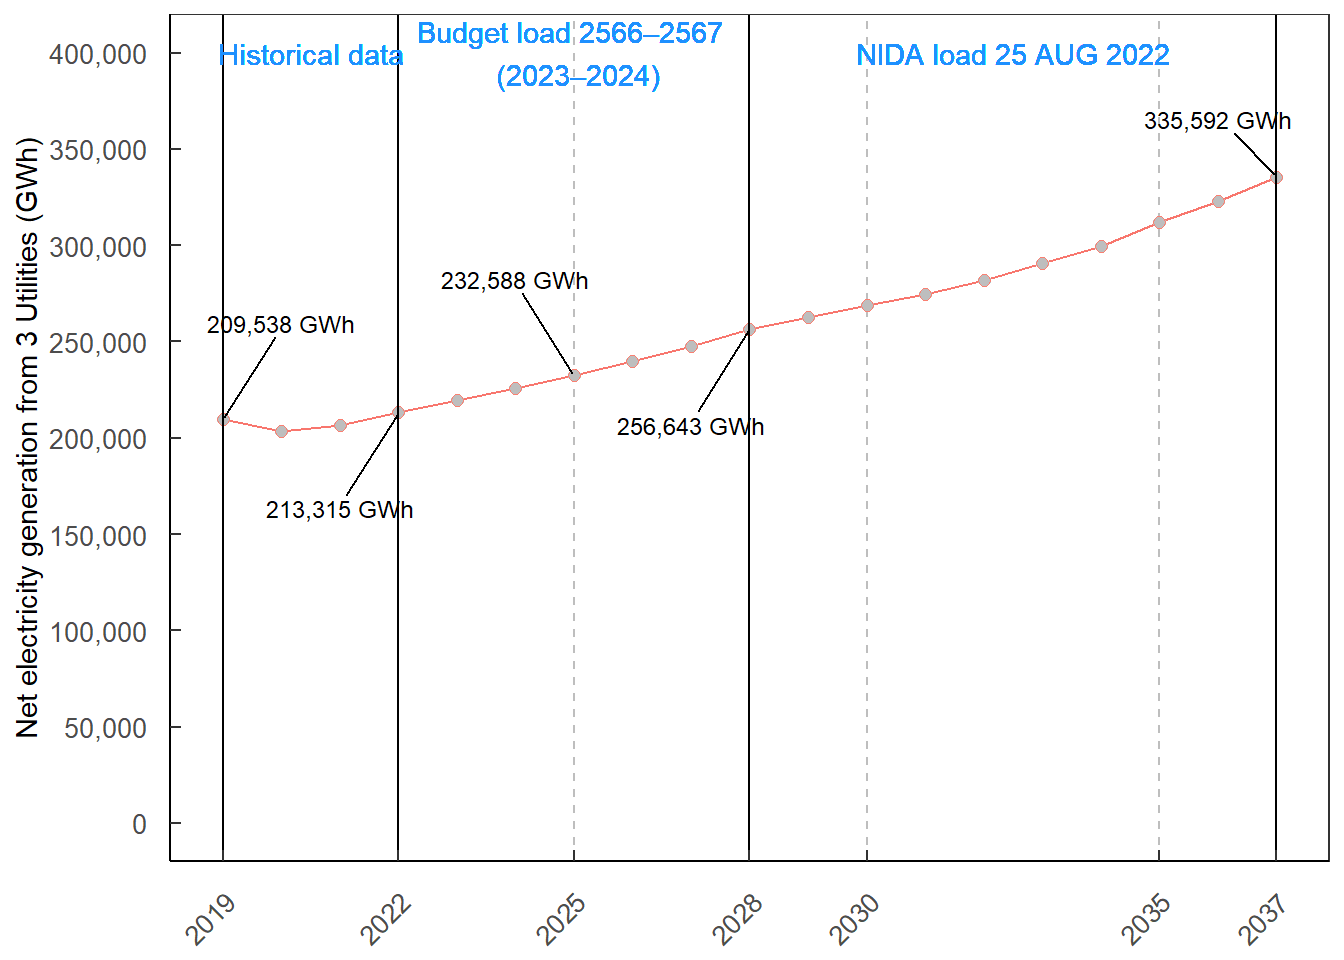
Chapter 12 Net electricity generation from 3 Utilities
This section explains the net electricity generation from 3 utilities. Those utilities consist of EGAT, MEA, PEA. The project combines the net electricity generation from 2 data sets as follows:
- The budget load 2566–2567 (2023–2024)
- The electricity load from the NIDA study approved on 25 August 2022
The net peak and the net electricity generation are obtained from R code chunks below.
- The Budget load 20 Oct 2022
b_load <-
  read_excel("raw_data/load25aug2022andbudegetload.xlsx", skip = 3) %>%
  select(year_th, year, peak_budget20oct2022, ene_budget20oct2022) %>%
  drop_na() %>%
rename(a = peak_budget20oct2022, b = ene_budget20oct2022) - The PDP2022 load BAU ND EE70%
pdp2022_load <- read_excel("raw_data/load25aug2022andbudegetload.xlsx", skip = 3) %>%
  select(year_th, year, peak_bau_nd_ee70, ene_bau_nd_ee70) %>%
  drop_na() %>%
  filter(year >= 2029) %>%
rename(a = peak_bau_nd_ee70, b = ene_bau_nd_ee70)- Combine 2 data sets by using
rbindfunction

Figure 12.1: Combined net electricity generation from 3 utilities from the budget load and the NIDA study